The Polygraph Place

Thanks for stopping by our bulletin board.
Please take just a moment to register so you can post your own questions
and reply to topics. It is free and takes only a minute to register. Just click on the register link


  Polygraph Place Bulletin Board
  Professional Issues - Private Forum for Examiners ONLY
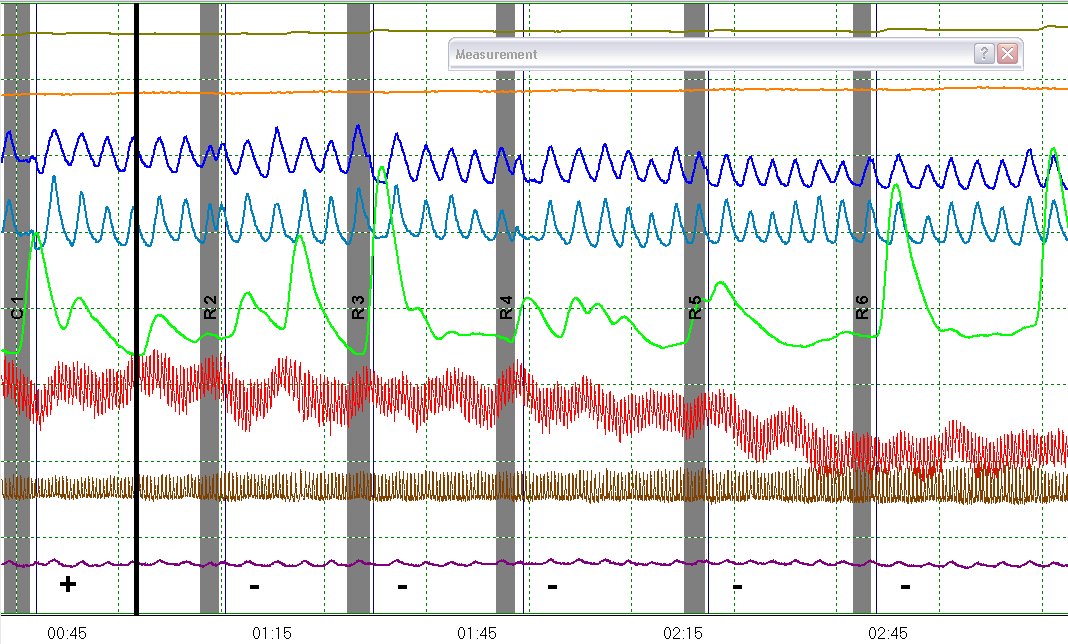
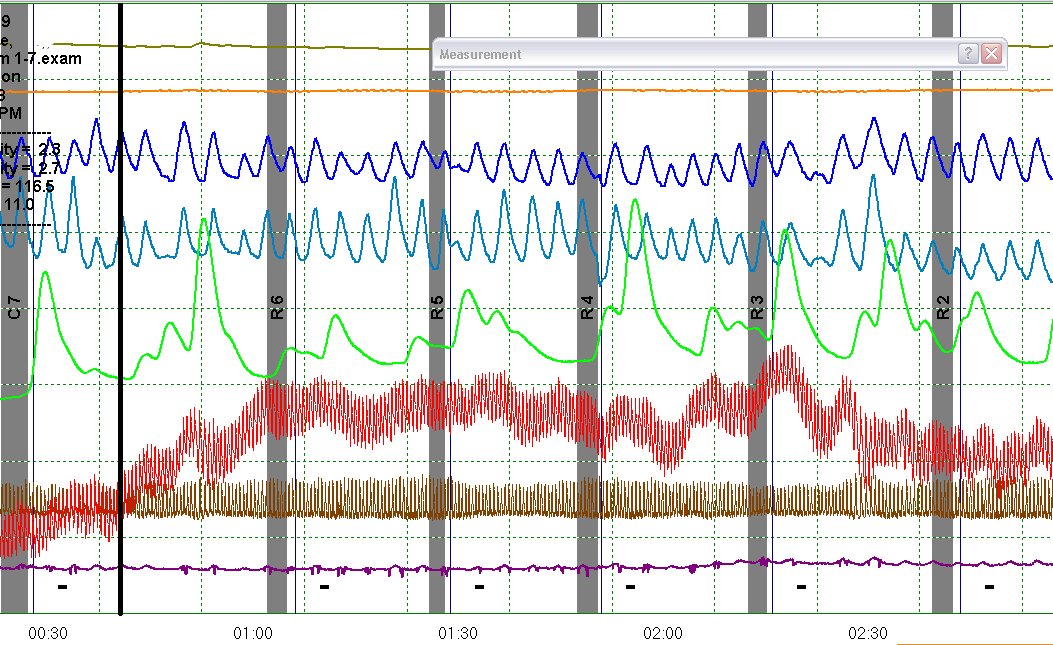
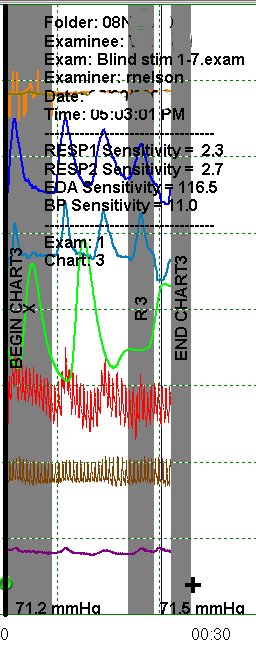
  another blind stim

Post New Topic  Post A Reply
profile | register | preferences | faq | search

next newest topic | next oldest topic
Author Topic:   another blind stim
rnelson
Member
posted 03-21-2008 09:39 AM     Click Here to See the Profile for rnelson   Click Here to Email rnelson     Edit/Delete Message
Had to work for this one.


First blind stim showed large reactions at 3 and 6. 3 is larger but 6 is concerning.

Second series is backwards.

This one showed large reactions to 4 and 3. 4 is larger, but 3 showed up on the first series. 6 is now the smallest reaction.

The third chart I prioritized my assumptions, by summing the rank order values. There are 5 ranks, for the values 2, 3, 4, 5, and 6.

Question 3 was (5) for chart 1 + (4) for chart 2 = 9

Question 6 was (4) for chart 1 + (1) for chart 2 = 5

Question 4 was (1) or (1.5 tied) for chart 1 + (5) for chart 2 = 6

He was instructed him to answer every question truthfully.

First choice was correct.


r


------------------
"Gentlemen, you can't fight in here. This is the war room."
--(Stanley Kubrick/Peter Sellers - Dr. Strangelove, 1964)

[This message has been edited by rnelson (edited 03-21-2008).]

IP: Logged

Gordon H. Barland
Member
posted 03-21-2008 01:20 PM     Click Here to See the Profile for Gordon H. Barland     Edit/Delete Message
Raymond,

Good call! There is an additional POT/CIT reaction criterion for the GSR which I don't believe is taught in any school. I "discovered" it in a 1985 study I did for the Government. It is an objective measure of the GSR magnitude fall-off from one question to the next.

Measure the GSR magnitude on question R(n), where n refers to the first scorable question on the chart. From that, subtract the GSR magnitude on the next question R(n+1). Similarly, subtract each subsequent GSR magnitude from the preceding one.

The question pair which has greatest fall-off from the preceding question to the subsequent one indicates that the preceding question is the critical item. You don't need to get out a ruler; eyeballing is usually sufficient to determine the pair which has the greatest fall-off.

That's a largely incoherent way of saying that the question following the critical item usually has a significantly smaller reaction than the critical item itself, and that the greater the reduction in amplitude, the greater the likelihood that the preceding question was the critical item.

It doesn't work in every case, of course, and it's not the only thing you need to look at, but it's one criterion and it sure worked in this case!

Peace,

Gordon

IP: Logged

stat
Member
posted 03-21-2008 02:36 PM     Click Here to See the Profile for stat   Click Here to Email stat     Edit/Delete Message
I have great regard for Gordon's research and his approach, but I never run more than one blind stim chart. The issue is not "hot enough" and habituation to the issue (a mere number lie) is likely.

[This message has been edited by stat (edited 03-21-2008).]

IP: Logged

stat
Member
posted 03-21-2008 03:26 PM     Click Here to See the Profile for stat   Click Here to Email stat     Edit/Delete Message
...also, I never mix the order. You typically see the anticipation, the stimulus to key, and relief when they are given the chronological series.

my 2 cents compared to your 2 dollars

IP: Logged

Gordon H. Barland
Member
posted 03-21-2008 03:27 PM     Click Here to See the Profile for Gordon H. Barland     Edit/Delete Message
The GSR criterion I described is deisgned primarily for POT & CIT tests, and applies within a single chart. On Raymond's first chart, we can't see what fall-off - if any - there was on C7.

Note that this "fall-off criterion" is somewhat analogous to scoring a CQT: it compares each relevant against the following question which thus serves as a quasi CQ. Finding the greatest disparity between the successive pairings on that chart helps identify the RQ to which he is deceptive.

Of course you look at all the other GSR criteria: the biggest single reaction, the highest peak on the chart, baseline changes, and changes in lability.

I know I'm inarticulate. It's hard to describe in words, but easy to show in an illustration. I'm simply not good at drawing and pasting to a bulletin board.

Gordon

IP: Logged

J.B. McCloughan
Administrator
posted 03-22-2008 10:53 PM     Click Here to See the Profile for J.B. McCloughan   Click Here to Email J.B. McCloughan     Edit/Delete Message
Gordon,

I thought you articulated the concept.

This is a brilliant concept and I would quite like to see any research done on it, as I think it has more than just surface scoring implications.

IP: Logged

All times are PT (US)

next newest topic | next oldest topic

Administrative Options: Close Topic | Archive/Move | Delete Topic
Post New Topic  Post A Reply
Hop to:

Contact Us | The Polygraph Place

copyright 1999-2003. WordNet Solutions. All Rights Reserved

Powered by: Ultimate Bulletin Board, Version 5.39c
© Infopop Corporation (formerly Madrona Park, Inc.), 1998 - 1999.